


.svg)


.svg)


The Regrid Property App Gets a Makeover
The Pursuit of (user) Happiness
During 2023, the Regrid team was working quietly behind the scenes to prepare a beautiful new version of the Regrid Property App’s interface for your web browser (you may have already tried the “beta version” we rolled out in December). I’m excited to announce that we’ve now opened this up to everybody as we advance our mission to be the household name for land parcel data and the leading enterprise provider.
The web app is beautiful, clear, and accessible, and I encourage you to jump right in. However, you can also read on to learn why we felt this was the right move for our users and the future of the Regrid Property App.
PS - So we’re clear on naming, the Regrid Property App has both a web app version you can use right in your browser, and a mobile app version you can download on your Apple or Android device. Both are built on Regrid’s parcel data and provide similar features, though the web app has more features accommodated by larger screens.
The Web App Journey
Regrid’s core business is parcel data (we reached a major milestone last year: 100% coverage of counties across the entire country), plus the tools to make that high-quality data useful to folks. We’ve got bulk data licenses for larger companies; an excellent Feature Service for people who want to integrate our parcels as a layer into the ESRI environment; APIs for developers and tech teams to plug our data into their apps and workflows; the Data Store, if you just want to buy a county or two; and the Regrid Property App, where we serve up our parcel data, plus the mapping tools needed to work with it, to a mass audience of users nationwide.
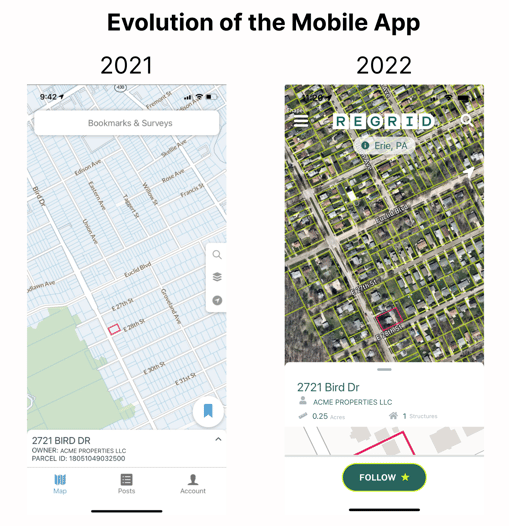
Last year around this time you may recall that we launched a substantial revamp of the mobile app side of the Property App. We made some key decisions based on user input about how the app needed to look and feel, and designed accordingly; over the past year, we’ve been gratified to see that work paying off as measured through substantially higher numbers of users and a higher level of user satisfaction.
This year, we wanted to do the same for the web side of the Property App. We saw it as a project that would help us achieve two simultaneous high-level goals: to make the Property App a great showcase that allows users to easily evaluate our data, while also improving the experience for users of the tools and features within the Property App.
Less is more
Before the current interface revamp (you’ll see me refer to this in shorthand as “UI”, aka User Interface), the existing setup was - I think it’s fair to say - somewhat cluttered, and sorely in need of some reorganization. Before our changes, the map UI contained two toolbars, a top nav with four (!) separate dropdown menus, plus miscellaneous other elements on the screen.
When we conducted user testing, we found most new users to almost universally be a little overwhelmed at the start; we knew we could do better. (When you hear things like “wow, that’s a lot of tools!” as a first impression, you know it’s time to start thinking about simplifying something. It’s not that having lots of tools is bad - users need many tools when it comes to a mapping platform - but users should be able to ease into a project, not be confronted with everything off the bat.)
-22016.png)
Changes we made
We organized our emerging ‘new UI’ changes around a couple core concepts:
1) Beauty
To a large degree, we wanted to get other elements ‘out of the way’ so that users could have a more focused, seamless experience with our data; to “let the American parcel fabric hang there like a painting”, as a friend of the company once noted. We also took care in selecting default colors and other presets that would make users’ default view as useful and as beautiful as possible.
2) Clarity
The easier it is for a user to complete a task, the better. That’s pretty much it! Interface complexity is a notoriously common problem for mapping tools in general, so it’s especially important to take care of the complicated stuff behind the scenes where possible so the user doesn’t have to. One major example of this in the UI revamp is the place/breadcrumbs. Where previously you had to manually had to change your location, in this version it automatically updates to reflect the place you’re looking at.
Similarly, we wanted to allow users to access tools when they wanted them - but not necessarily have them be there on the sidebar permanently, cluttering the view. So we made the toolbar collapsible: now, if you want to see just the map itself with minimal distraction, it’s just a click away.
3) Accessibility & Functionality
Common sense, perhaps, but we wanted to make sure that anything a user could do previously in the old UI should also work in the new one - and we wanted to make sure that anybody, from a total map novice to a GIS pro, could intuitively access all that we offer. In some places we were able to substantially improve a tool’s function (for example, check out the new Measure options); at the same time, we took pains to ensure that nothing went away entirely.
-1cde6.png)
More than just a pretty face
In addition to the interface changes, we knew that we also needed to improve how the map works behind the scenes. Specifically, we needed to upgrade the parcel layer - aka the layer that provides the property boundaries overlaid on the map. In the past we had been using raster tiles to provide this layer, but rasters have more limited functionality and at this point they were blocking us from providing some much-needed functionality; one especially frustrating example for me was the way the default parcel line color in the old UI was green, which made it almost impossible to see on a satellite map.
7aa8.png) Moving to our in-house vector tile layer was the right move: not only does it allow the Regrid Property App to showcase how our vector tiles API product can be used in a mapping platform, but it also allows us far more flexibility in styling and to add new features moving forward. One great example of this is the ability in the new UI for users to customize the styling of the parcel layer - now, each user can change those to any color they like, at any time.
Moving to our in-house vector tile layer was the right move: not only does it allow the Regrid Property App to showcase how our vector tiles API product can be used in a mapping platform, but it also allows us far more flexibility in styling and to add new features moving forward. One great example of this is the ability in the new UI for users to customize the styling of the parcel layer - now, each user can change those to any color they like, at any time.
af3d.png)
Similarly, we took the chance to significantly upgrade our Measure tools. Among other small touches, you can now edit a shape you’ve drawn, and change the units of measurement with a click - things users have been asking about for years.db28.png)
Where to next?
This revamp of the Regrid Property App on the web side has cut through some of the thorniest UI problems that previously existed, and provides an excellent base from which to do some truly interesting things - we’re very excited to get started.
Over the coming year, you’ll start to see some of these improvements. For example, the parcel details, and some of the inner workings of other tools, are slated for a visual refresh shortly; these should make it easier (and more attractive) than ever before to quickly see and understand the excellent parcel data we have from coast to coast. We’ve also got some longer-range projects cooking which it’s slightly too soon to talk about, but which will provide new levels of interest to the platform.
In the meantime, we really hope that you enjoy the Regrid Property App’s new look! Don’t forget that if you have any feedback for us about the new UI, you can leave that in this form, and if you want a quick tour of the new UI, that can be found lovingly narrated by yours truly below.
Finally, one more note: if you like what we’re doing on the Property App and would like to try out new features before they’re public, please let us know via this extremely short form and we’ll get you on the list for the future.
