


.svg)


.svg)


Nationwide Parcel Data: From Cold, Metal Chains ... to your Database.
Reposted from Jerry Paffendorf's guest blog on makepath.com
https://makepath.com/parcel-data-landgrid/
----------------------------------------------------
Note about the author of this guest post: Jerry Paffendorf is co-founder and CEO of Loveland Technologies, makers of landgrid.com. Landgrid and makepath partner together on special projects.

“In the mid-19th century, when the cold tongue of land that is the Michigan peninsula was first being sliced up for development, the surveyors began to discover problems with their measurements, particularly during the winter. The lengths of metal chain they doggedly carried and laid out like giant rulers across the forests and swamps would shrink when the temperature dropped below zero.
“The resulting inconsistencies would only add up to a few inches a day, but over the vast distances of midwestern America the shrinking chains threatened to cause future disputes between landowners. Until a conscientious surveyor called William Burt came up with a solution: every frosty morning, he built a fire and warmed up his chain until it expanded back to exactly its original length.
“Such diligence, respect for figures, and slightly bloody-minded defiance of the elements is a very American combination. So to try to understand the country by describing how it was first surveyed and divided up, as this book does, is likely to be a fruitful enterprise.”
From a book review of Andro Linklater’s book, Measuring America, published by The Guardian
My company specializes in providing nationwide parcel data: the legal boundaries of properties along with addresses and information like ownership, land use, occupancy, buildings, and other data points that can be attached to parcels. It’s been a consuming pursuit as property boundaries underlie everything and form a natural ice cube tray for other data.
Parcels look like this, seen here with building footprints overlaid:
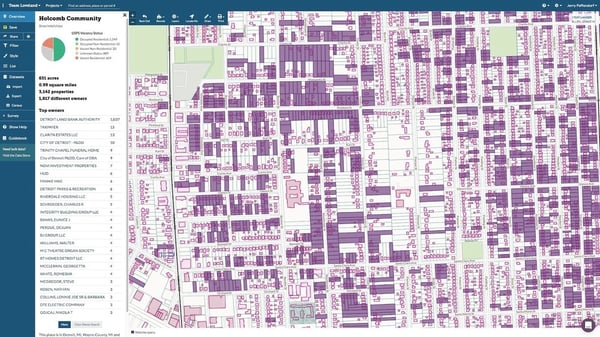
We are based in Detroit, Michigan and originally got into parcel data to help address challenges in the city. At its peak population in 1950, Detroit had about 2 million people and was America’s fourth largest city. Today it has about one-third of that, making its ratio of people to properties much different than the mid-20th century, with all of the attendant stresses to the tax base, maintenance, services, and occupancy you can imagine.
During Detroit’s bankruptcy in 2013 we were hired to assess the current land use, occupancy, and conditions of every single parcel of land in the city for a project called Motor City Mapping. The interactive map, photos, and dataset are archived at motorcitymapping.org.
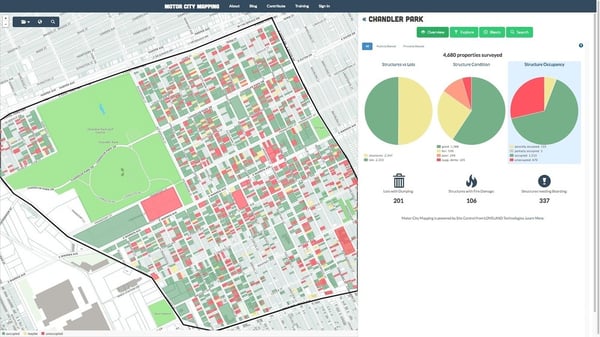
For that project, 200 Detroiters used our software and mobile app to photograph and describe each property. In the process they identified more than 50,000 vacant buildings and tens of thousands of occupied homes that were at imminent risk of tax foreclosure, among other pressing challenges and opportunities in the landscape.
The data was combined with other datasets and kicked off a wave of innovative data and mapping projects in the city, and provided some much needed insight into the landgrid.
We wanted to be able to do something like that anywhere in the country, which meant we needed nationwide parcel data. Not having any other way to attain it, we set about collecting it from every single county ourselves.
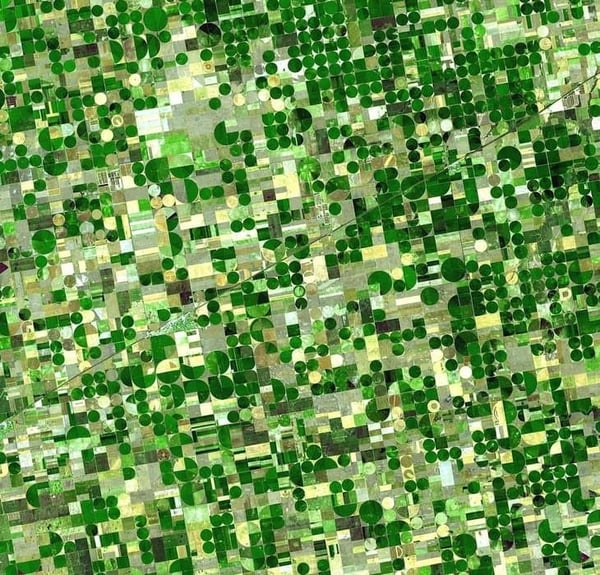
That really sent us down the rabbit hole and got me reading about the history of how and why these parcels came to be in the first place. If you’re looking to read some fascinating history that you may not know much about — I certainly didn’t — do yourself a favor and google the US Public Land Survey or pick up Andro Linklater’s book, Measuring America: How the United States Was Shaped By the Greatest Land Sale in History.
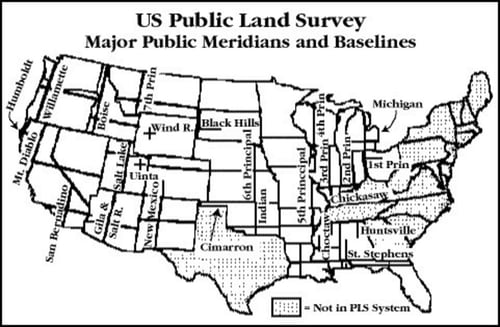
(US Public Land Survey - Image Credit )
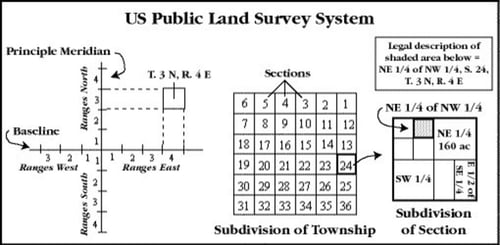
Long story short, at Thomas Jefferson’s urging, and to create a spatial framework for a new nation of citizen farmers, starting in 1790 most of America outside the south and the original colonies was measured out and subdivided into square mile sections by people dragging metal chains through the woods, across rivers, over mountains, you name it. Every six by six squares was called a township. Townships snapped into counties, and counties snapped into states. The land was typically auctioned and then further subdivided over the years, decades, and centuries into the residential, commercial, industrial, agricultural, recreational, and wild parcels we know today.
You can stare at maps and see the straight lines of many states and counties, but it’s easy to overlook that they represent a nested fractal leading down parcels, which are the atomic unit of owned and managed space in society. Within that landgrid are so many accidents and arbitrary happenings that it makes you wonder how we might one day redraw it or return parts of it to nature. (PS if you like pictures like the one from Wikipedia above, check out the Instagram account, thejeffersongrid, which focuses on big square parcels.)
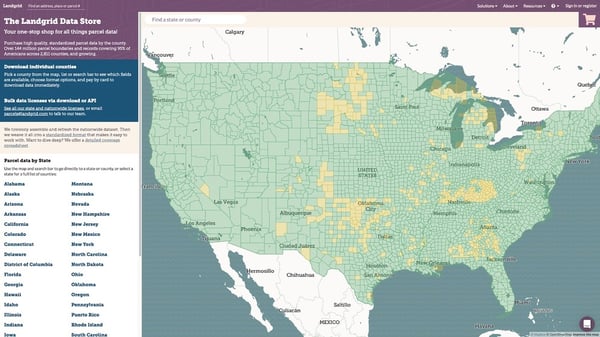
Our dataset currently consists of 144+ million parcels covering 95% of US residents. You can see a coverage map here, and you can see details about the data by clicking through to any county. Sometimes when the work is hard I think about that person warming their chain in a fire before dragging it through the woods another day, and it feels a little less hard to wrangle digital files with a LaCroix next to my keyboard.
We make the parcel data available for other people to use in their own research, apps, projects, and databases. Every day I wake up with a kaleidoscope of customers and partners and curious people in my inbox who span real estate, energy, insurance, agriculture, forestry, marketing, transportation, outdoor recreation, government, planning, and other industries that touch property, land, housing, and spatial analysis.
Sometimes people want to use the data for geocoding other datasets to a map. Sometimes they need to know who owns things. Sometimes they need to tell open land apart from land with buildings, or they need to identify occupied or vacant properties. Sometimes they need to do door-to-door outreach. Sometimes they use the data for business and sometimes for the joy of discovery.
Moving into the future, we’re really excited about the opportunities for combining parcel data with Machine Learning and aerial imagery. With the parcel boundaries as the picture frames, there are many new data fields and insights that will come from training software to identify the features within a parcel and turn that into structured data to give even greater insight into the grid and how we inhabit it.
All of this is what makes the work we do so exciting, and it’s why we value partnerships with data scientists like makepath who can take a massive, fundamental dataset like this and make new knowledge from it.
If we can assist you with parcel data, or if you just want to rap about how crazy the history is and what the future of parcels could look like, please reach out to me at jerry@landgrid.com. And please be safe in these unprecedented times!
